 button on the Window toolbar or pressing the F2 function
key.
button on the Window toolbar or pressing the F2 function
key.The Window toolbar (See Graphic Display for more information) offers some common graphical plotting
choices, but these are just a few of the options available. Many more options
are located in the Model Display Options dialog which may be accessed by clicking
the button on the Window toolbar or pressing the F2 function
key.
The options are organized into groups of items. Access each group by clicking on the tabs along the top of the dialog box. Some of the options are mutually exclusive and others are conditional. Typically, only one option in a vertical row may be chosen at a time and indented options will not be applied if the heading option is not also applied.
Each of the groups presents the option to turn off those particular items in the view. This is not the same as unselecting the items. Turning items on and off is independent from selecting and unselecting. For example if you make a selection of beams and then turn off beams all together, the selection still stands for any modification applied to beams.
Each of the Model Display Options dialog tabs is described in its own section:
You may make any Plot Option settings the default start-up settings. To do this, go through all the Model Display Options tabs and set all the options to what you want as the start-up default. Once that is done, select the Misc tab and press the button labeled Make Current Plot Settings the Default.
Note:
Access the Model Display Options for Beams button on the Window toolbar and selecting
the Beams
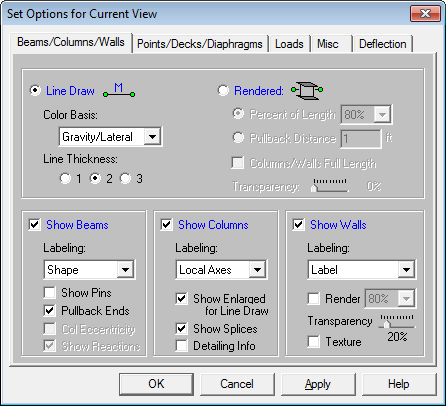
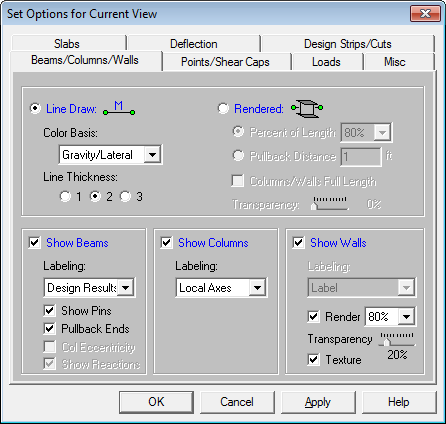
If the Line Draw option is selected, you may include
textual information alongside each beam
Color Basis draws the beams using various
colors to represent particular information such as
If the Rendered option is selected, true
to scale representations of the
The rendered option is very useful for verifying member orientations and modifying the rendering options can provide a better understanding of intersection areas and a better view of the member cross-section.
The Detailing Info check box pertains to information that is for export through the CIS\2 Translator. See the Cardinal Points topic for more information.
Access the graphical Model Display Options for points, decks, and diaphragms (beam supported floors only) or points and shear caps (slab supported floors only) by clicking the Model Display Options button on the Window toolbar and selecting the appropriate tab shown below:
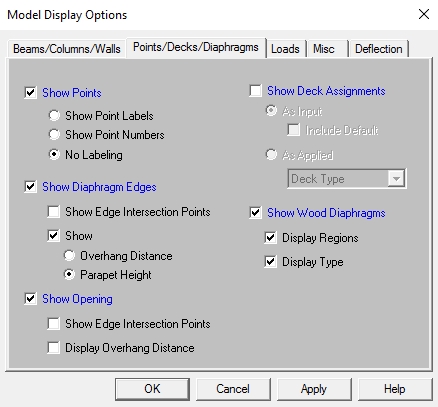
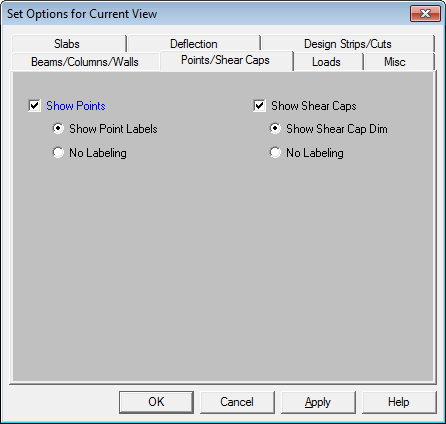
Checking the Show Points box will turn on the display of points in the current model view. You may include the point labels, point numbers, or turn off labeling by checking the corresponding radio buttons.
Checking the Show Diaphragm Edges and/or Show Openings box will turn on the display of diaphragm and/or opening edges. The display of edge intersection points can be turned on by checking the Show Edge Intersection Points box. The diaphragm/opening overhang dimensions can be displayed by checking the Display Overhang Distance box. The dimension shown in the model view is the distance from the edge of the diaphragm edge or opening to the center-line of supporting beam or wall.
Checking the Show Deck Assignments box will turn on the display of deck/slab assignments in the current model view. Assignments may be shown 'As Input' or 'As Applied' by clicking the corresponding radial button.
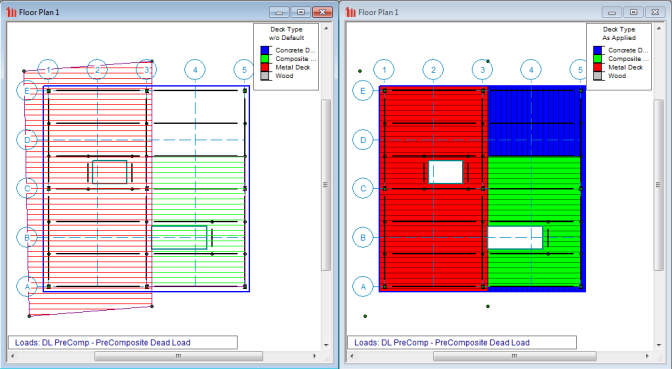
The image on the left above shows the deck as drawn in by the user. The approximate orientation of the deck is shown with the hatching lines. The color of the hatching lines corresponds to the deck properties as defined in the Deck Definitions spreadsheet. The legend at the top right of the screen shows which decks correspond to which colors.
The image on the right shows the deck as it was applied within the diaphragm edges by the program. This shows how the deck is actually applied to the floor system and where it is not applied- such as outside the diaphragm edge or within openings. The color corresponds to the deck properties as defined in the Deck Definitions spreadsheet. The legend at the top right of the screen shows which decks correspond to which colors.
Checking the Show Shear Caps box will turn on the display of column shear caps in the current model view. The shear cap dimension can be turned on by checking the Show Shear Cap Dim box. Note: this is only available for slab supported floors.
Access the graphical Model Display Options for button on the Window toolbar and
selecting the Slabs tab shown below.
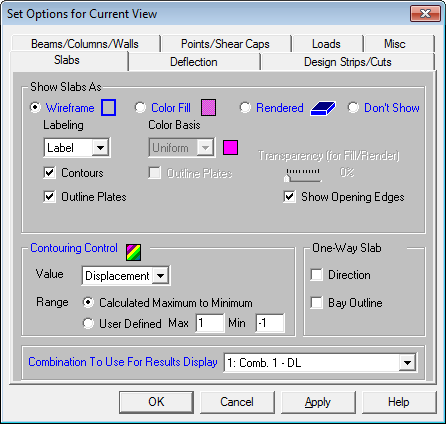
Note: This tab is only available for concrete slab supported floors.
The Show Slabs As... section of this tab allows you to specify
that
When the Wireframe option is selected,
you may include information on the
When the Color Filled option is selected,
Note:
The Color Contours are plotted with
a global smoothing algorithm that allows the contour to vary across the
plates
The Contouring
Control section determines what force or stress result is to be contoured
and how the contour colors are to be assigned. The Value drop down
list is where you select the specific result to be contoured (
When the Rendered option
is selected, true to scale representations of the
The Transparency setting described above for Color Filled plates also applies to Rendered plates.
The One-Way Slab check boxes control the display of the one way slab. The Direction check box toggles on and off the display of a direction arrow. Selecting the Bay Outline check box will turn on a highlighted view of the bay area over which the one way load is distributed.
Access the graphical Model Display Options for loads by clicking the Model Display Options button on the Window toolbar and selecting the Loads
tab shown below.
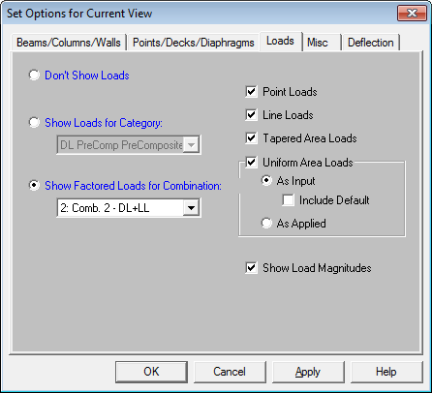
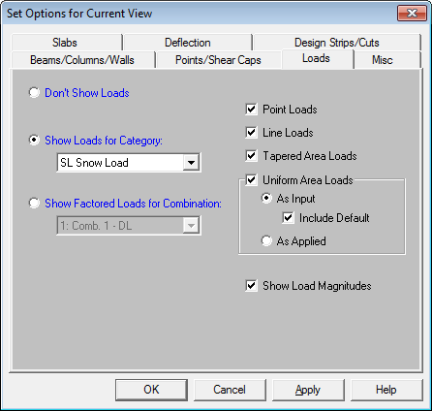
You may specify that the loads be drawn as Load Categories or Load Combinations by selecting the corresponding radio button. The load types to be displayed can be selected by checking the corresponding boxes.
Once you set the Model Display Options for loads, you may then run through
all of the load categories
or load combinations by choosing them from the drop down list  on the Window
toolbar.
on the Window
toolbar.
Access the Model Display Options for deflections
by clicking the Model Display Options button on the Window
toolbar and selecting the Deflection tab shown below.
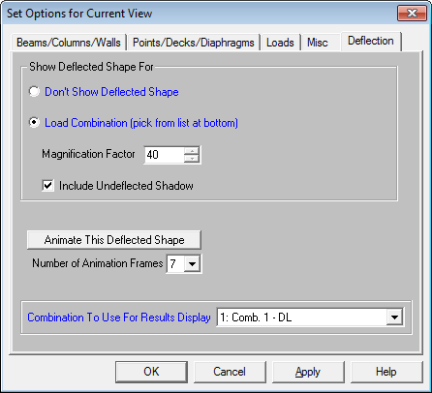
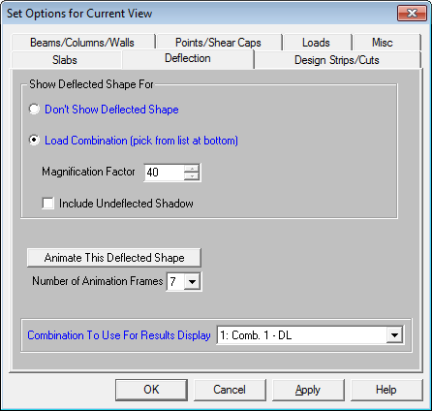
In the Show Deflected Shape For... section of the tab you may specify that a deflected shape
be drawn in the current model view based on a load combination. You can control the magnification of the
deflections with the Magnification Factor text box and specify whether an undeflected shadow is to be shown by checking the Include Undeflected Shadow box.
To animate a particular deflected shape, first select the deflected shape (as described above) and then simply click the Animate This Deflected Shape button. A new model view will be created with the animation. The Number of Animation Frames drop down list allows you to specify how many frames are used in the animation to move from the undeflected state of the model to the fully deflected state.
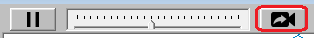
In the model view of the animated deflected shape, the Capture feature allows users to save video file format of the animated deflected shape. To use this feature, adjust to the desired number of frames and click on the video button. The user will be prompted to save the video file.
Note:
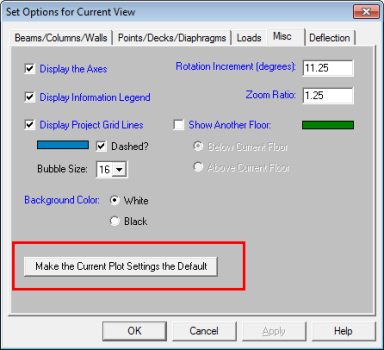
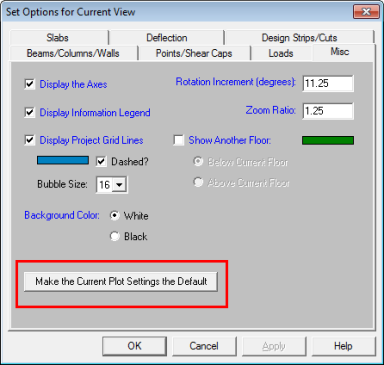
Access miscellaneous plotting options by clicking the Model Display Options button on the Window toolbar and selecting the Misc
tab shown below.
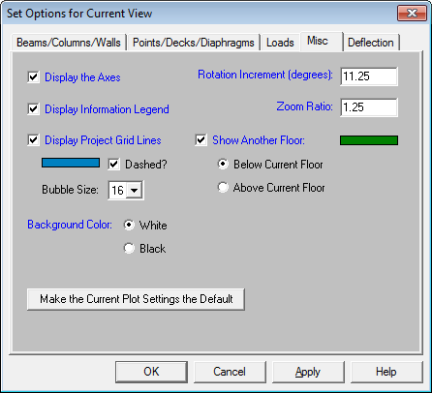
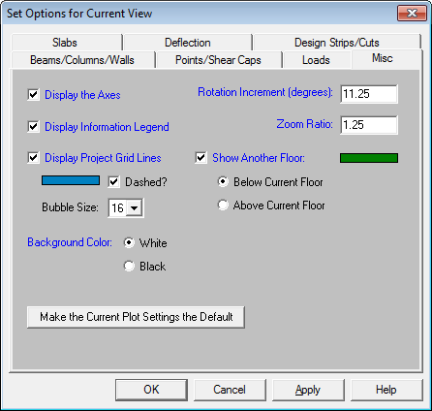
You may indicate whether the global axes icon is to be displayed in the upper left corner of the model view by checking the Display the Axes box. You also have the option of displaying the informational legend drawn in the bottom left corner of the model view by checking the Display Information Legend box. This legend has information such as which combination has been solved, which loads are being displayed, etc.
Checking the Display Project Grid Lines box will turn on the display of the project grid in the current model view. The color and line type for the grid may also be customized. Click the colored rectangle to choose a custom color. Check the Dashed? box to display grid lines as dashed lines. The Bubble Size drop down list allows you to choose a font size for the grid labels and the bubbles that encompass them.
You may specify whether the Background Color for the model view is to be black or white by clicking the corresponding radial button. A black background shows colors more vividly, but a white background shows a more realistic representation of what you'll get if you print the graphic view.
By entering values in the text boxes, you may control the Rotation Increment and Zoom Ratio that will be used with each click of the corresponding toolbar buttons on the Window Toolbar.
When the Show Another Floor option is selected you will see members from the floor above or below superimposed in a different color on the Plan/Iso view of your current floor. This is useful for laying out new floors, in that you can see where the columns/walls exist on the floors above or below. You can also use these elements as snap points for modeling.
Finally, you may make any plot option settings the default startup settings. To do this, go through all the Model Display Options tabs and set all the options to what you want as the startup default. Once that is done, press the Make Current Plot Settings the Default button. This button applies to ALL the Model Display Options tabs.
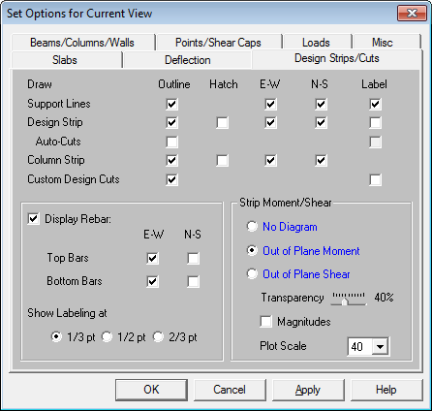
Access the graphical Model Display Options for design strips by clicking the Model Display Options button on the Window toolbar and selecting the Design Strips/Cuts tab shown below.
Note: this plot option is only available on concrete slab floors.
The Draw table allows you to check on or off the selected view options. These include slab Support Lines, Design Strips, AutoCuts, Column Strips, and Custom Design Cuts. Notice that you have various display options for each selection. Outline and Hatch control how the item regionis displayed. E-W (East - West) and N-S (North - South) control the directional selections and Label allows you to view the item's label.
The Strip Moment/Shear section of this tab controls the display of moment and shear diagrams on each design strip. Out of Plane Moment diagrams and Out of Plane Shear diagrams can be plotted on each design strip by clicking the corresponding radial button. The diagrams themselves may be presented with varying degrees of Transparency with 100% transparency meaning an outline of the force diagram and 0% indicating a solidly filled diagram. The transparency is controlled by clicking and dragging the slider bar until the desired percentage is displayed below the bar. Checking the Magnitudes box will turn on the display of the force magnitudes corresponding to each design cut within the design strips. The relative graphical scale of the moment and shear diagrams can be controlled by selecting a factor from the Plot Scale drop down list.
Note:
Note: this plot option is only available on concrete slab floors.
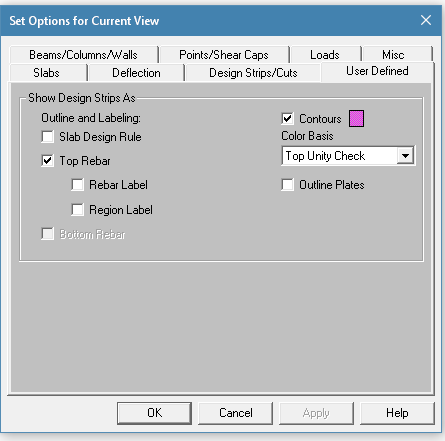
Slab Design Rule will display the name of the Design Rule on the slab. Checking the Top Rebar will show the Region above the Columns/Walls with the Rebar label shown after solution and the Region Label will show the size of the Top Rebar region. Bottom Rebar will be available after solution and it will display the rebar for the entire slab.
The Contours are displayed for Top and Bottom Unity Check with an option to turn on the plate outlines. These options are available after solution.